One of my key responsibilities in the Ministry of Education was to develop social media analytics capabilities. It was a comprehensive workstream that looked at designing social media metrics, monitoring Key Performance Indicators for our online publications, establishing social media benchmarks and identifying anti-narratives. To implement these, I built a Facebook Analytics dashboard prototype in Tableau for use across the entire ministry, which was eventually extended to other social media platforms.
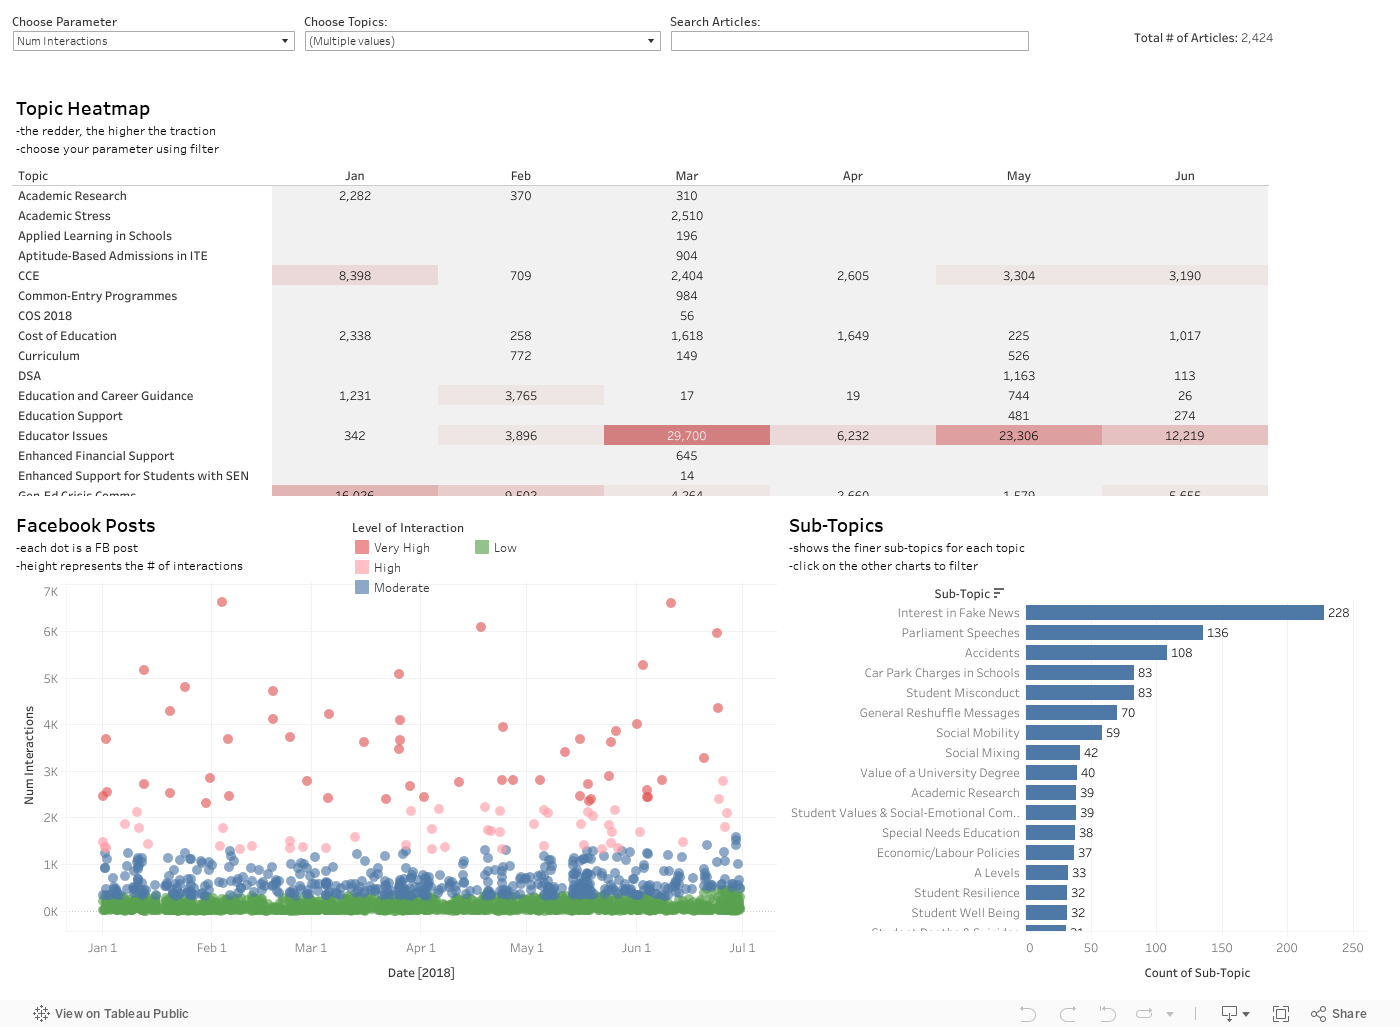
I first started off with extensive focus group discussions with parents, educators and policy colleagues within the ministry. It was important for me to understand the key education and policy issues that parents and government officers were concerned about. Their views gave me a comprehensive list of education topics to monitor. The heatmap alone you see above was a month-long engagement product.
I signed up for the Facebook Developer API, which granted me access to post and comment data on the Facebook pages of various media outlets. Subsequently, I wrote a Python script that automated the webscraping on a daily basis, to obtain the number of comments and interactions for each news article posted by a media outlet, coded as line-by-line data.
Both Machine Learning and key-word tags were employed to sort the news articles into the topics present in the topic heatmap. The key-word tags were developed during the course of the focus group discussions, again illustrating the importance of stakeholder engagement.
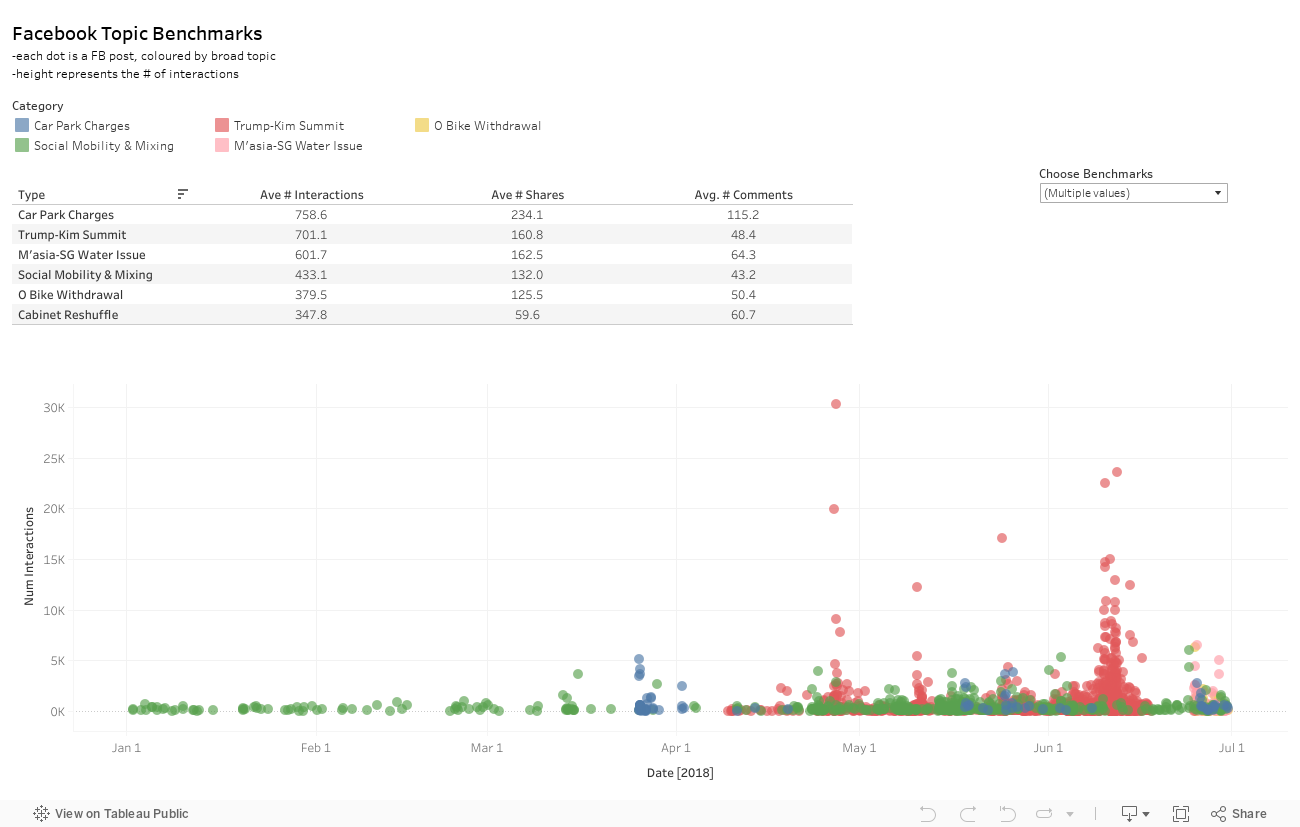
A huge part of non-coding work was to develop the KPIs and metrics for each social media platform. But the hardest part was developing benchmarks - how would we know whether a certain level of interaction was considered high, moderate or low? In order to determine the relative levels of traction, I performed a deep dive into the traction levels of competing narratives and news interests.
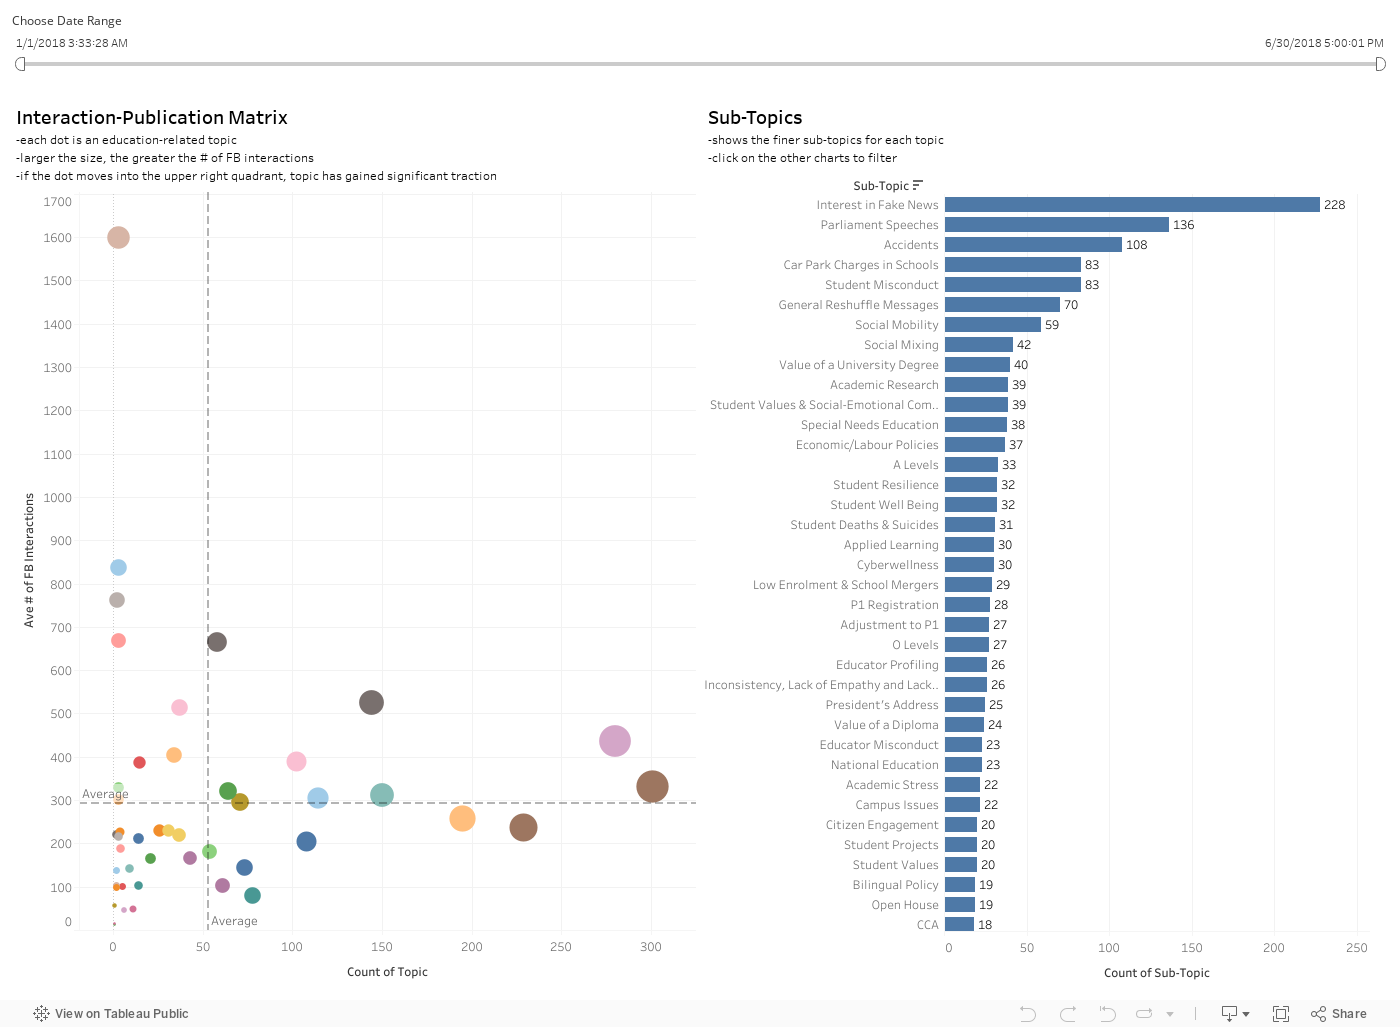
With a myriad of topics that faded in and out of interest over time, it was important to help Senior Management focus on topics that mattered. Again, not so much coding work, but more of understanding what were the important social media metrics to focus on. I developed a time-sensitive framework based on the number of articles published and the number of Facebook interactions generated per topic. Urgent and hot topics laid to the upper-right, while distractions appeared on the lower-left. The rest, depending on their time-trails, would either be emerging narratives, or dying topics.
Data visualisation has since remained one of my interests. It grants the power of data democracy to both Senior Management and front-line executives in terms of everyday decision-making.
Find more projects on my blog. Have a suggestion? Contact me at [email protected].